Community Embraces New Word Game at Mid-Year Play Day This past Sunday, families at Takoma Park’s Seventh Annual Mid-Year Play Day had the opportunity to experience OtherWordly for the first time. Our educational language game drew curious children and parents to our table throughout the afternoon. Words in Space Several children gathered around our iPads […]
Read moreIDEA’s older programs provide insight into the organization’s thought leadership, as well as our innovative solutions that formed at the crossroads of technology and education.
ColoRotate
“Color theory” is often obsolete or based on inaccurate theories of vision. IDEA’s ColoRotate improves users’ intuitive understanding of how colors work, without requiring them to have a theoretical understanding of color systems or expertise in color selection.
IDEA launched ColoRotate on the Web (requires Adobe Flash), as a plugin in 2009-2013 versions of Photoshop, and as an iPad app. In the app, ColoRotate acts like a spectrograph, allowing users to examine color distribution in photographs. Users can build palettes from existing images, generate random palettes, or make precise adjustments with sliders and a joystick. The app directly syncs with Photoshop for digital art courses.
ColoRotate was praised for turning the iPad “into the ultimate Photoshop color-picker” by Cult of Mac and received MacGasm’s App of the Week award for October 20, 2012.
This web-based color palette generator is a fun and visually appealing method for putting together your color combinations. You can explore and tweak preexisting color palettes for inspiration, or create your own. You can also view color palettes in a variety of ways to give you a greater perspective on how well your colors work together.– Mashable’s #1 Fresh Web Tool for Working With Colors,
June 2010
ColoRotate brings color palettes to life in 3D and allows you to adjust the hue, tint and blend of your palette with an easy to use tool. The website also has a ‘learn about color’ section that’s great for first-timers.– Innovation Excellence,
June 20, 2013
There’s no straightforward formula to convert CMYK color to RGB colors or vice versa, so conversion is typically dependent upon color management systems. ColoRotate easily converts one system to the other.– AB Sallow, ZM Taha, AS Nori,
University of Mosul College of Computer Science and Mathematics,
November 2010
Because graphics giant Adobe adapted their interpretation of ColoRotate’s 3D view into their app, IDEA’s concept is reaching a mass audience.

American Association for State and Local History
Archivists and related professionals are the intermediaries between America’s documentary heritage and the general public. Many have the desire to digitize collections but lack the resources to easily do so. In response, IDEA developed a responsive professional development website for the American Association of State and Local History.
We created a structure for thousands of resources, as well as a showcase for best practices gleaned from AASLH’s annual awards program. At our urging, the organization launched a blog network to appeal to specialists, such as those working in the fields of women’s history, historic houses, and interpreting and incorporating religious history.
Built on a WordPress platform, the website provides historians with ways to connect with affinity communities, access to a jobs board, and tools to assess organizational practices.
SpicyNodes
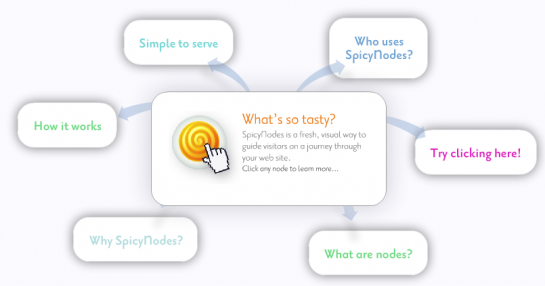
IDEA’s SpicyNodes project sought to display online knowledge in a way that mirrored how people interact with information in the real world.
The project expanded the theoretical underpinnings of concept mapping and took shape as an Adobe Flash-based radial mapping tree. In 2009, SpicyNodes launched as a web-based data visualization tool used by individual and organizational subscribers to create content portals, mind maps, sitemaps, and even poetry. Along with the product, IDEA provided guides for students, teachers, developers, copywriters, and academics. The SpicyNodes community forum allowed users to post questions and share nodemaps.
Our visualization tool was viewed by more than 40 million web users, and our authoring tool had more than 315,000 user accounts. Users created more than 580,000 nodemaps between 2009 and 2016, when the authoring system was shuttered.
Blog
From 2009 to 2014, IDEA’s blog reached an audience of executive-level staff at educational institutions, and covered practices of museums, publishers, developers, and research labs that related directly and tangentially to scientific and cultural literacy. The blog articles remain on this web site, searchable via the archive.
On the blog, few topics were off-limits. We examined the role that MOOCs could play in educating those in the developing world. Using fan fiction as a launching point, we discussed the ways in which art and culture are owned by society, rather than by their creators. Back in 2012, we promoted the use of certain Twitter hashtags for education and outreach. And we analyzed the various facets of crowdsourcing and how they could be incorporated into project frameworks.
Color Vision Tool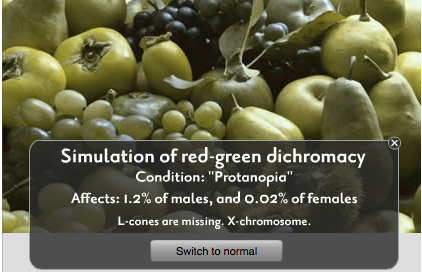
IDEA developed the Flash-based Color Vision Tool to enable web designers and developers to select colors and designs that are accessible to users with color blindness and cataracts. Developed in 2009, the Color Vision Tool allows users to manipulate images to simulate cataracts, red-green and blue-yellow color blindness, and monochromacy. At the time, this was a novel tool; we are delighted that newer graphics software packages often provide color blindness simulations.
 Prostate Calculator
IDEA has been adept at developing single-function websites that deliver precise information that visitors need. Launched in 2000, ProstateCalculator.org used neural networks and aggregated patient data to provide visitors with information across a range of prognostic areas, as well as in-depth medical information and individualized, pattern-based risk predictions. The user interface was IDEA’s responsibility, and enabled patients to use the results of the neural network online.
ProstateCalculator’s survival tables have been cited in Prostate Cancer: Science and Clinical Practice, where the calculator was given high scores for ease of use and updates. It was also cited by Babak Oskooei at the London Hub for Trials Methodology Research, who listed it among a number of cancer prognosis calculators from well-known organizations in academia and medicine. Urology described Prostate Calculator as “an easy to use Web-based tool.”
Older apps
Mobile, multi-touch apps can enhance scientific, artistic, and cultural literacy. IDEA previously published these apps:
- WikiNodes put the encyclopedic knowledge of Wikipedia at the fingertips of Apple iPad users, and used IDEA’s SpicyNodes system for displaying and navigating information. WikiNodes was downloaded and installed more than 29,000 times.

- SpringAhead was an eBook and tool for finding out when and where people observe Daylight Saving Time and Summer Time, and when they should switch their clocks.
- Popstamatic created 1960’s Pop-art silkscreen style artwork from photographs.

National Clocks
We built web-based national clocks for the U.S. and Malaysia. IDEA was an innovator in government web services, designing and launching time.gov, the U.S. National Clock, in 1999. IDEA designers worked closely with the Standards and Industrial Research Institute of Malaysia (SIRIM) to develop the Malaysian National Clock, which was launched in 2006. Aesthetically appealing, web-based interfaces allow users to conveniently access their official national time – across different time zones if necessary.
Native American Cancer Education
From 2003 to 2006, IDEA worked with a nonprofit organization (natamcancer.org) that develops and delivers cancer education to Native Americans, a community that is woefully underserved in both healthcare and health education. At the time, the community was on the wrong side of the digital divide, with very limited Internet service, access to computers, or knowledge of computers. It was a time when VHS tapes were still being used at clinics for patient education.
 We worked on several tools for the community. One helped illustrate how Native women can speak more assertively to their healthcare providers with “I-Messages,” such as “I feel frightened when you use big medical words. I want you to speak slowly and use smaller words because English is my second language.” The tool was an audio synthesizer that could generate thousands of example sentences. Another tailored online content based on short preliminary surveys about the user. For example, the tool enabled survivors’ word choice preferences (e.g., “American Indian,” “Native American,” “Aboriginal”) to be incorporated into the information presented. We also developed a system of code names to protect survivors’ identity (e.g., “blue heron soars,” which was consistent with names common to many Native American communities vs. a username like “sally5000,” which was familiar to experienced computer users). We also developed a series of video vignettes about various aspects of care, since storytelling is a familiar way to share and learn knowledge. A survivor’s 10-minute story about their care and how they worked on their nutrition was more effective than, for example, a printed pamphlet or a doctor saying the same thing.
A few other collaborations
IDEA’s expertise in interactive technologies has paved the way for exciting collaborations with a variety of institutions, museums, organizations, and individuals.
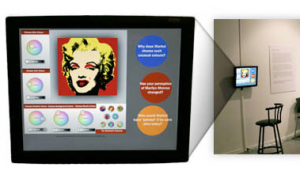 In 2008, IDEA collaborated with the Art Gallery of Greater Victoria on their “Warhol: Larger than Life” exhibition. Working with Jonathan Lathigee and curator Helen Delacretaz of the Winnipeg Art Gallery, IDEA helped adapt its interactive color-changer of Andy Warhol’s famous Marilyn Monroe silkscreens into a kiosk that visitors could manipulate by touch.
IDEA provided translations of selected letters from IDEA’s “Van Gogh’s Letters” WebExhibit to Victoria Charles, author of Vincent van Gogh (2008, Parkstone Press Ltd., ISBN 978-1844844791). Excerpts of that book, courtesy of the publisher, are available in our “Van Gogh’s Letters” exhibit.
IDEA collaborator Michael Henchman shared expertise from the Vinland Map WebExhibit, which explores whether or not the Map proved that Vikings came to America, with producer Gary Glassman on NOVA’s episode, “The Viking Deception.” IDEA also provided images for the television program.
From 2003-2010, IDEA sponsored and managed the email list for the Diatrope Institute’s Art & Science Discussion, which is directed by Amy Ione. List subscribers discussed new frontiers in the interrelations among art, science, technology, and visual studies.
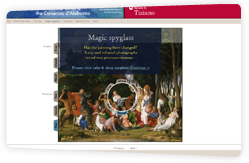 In 2003, Museo del Prado held a major exhibit on Titian, the leader of the 16th century Venetian school of Italian Renaissance painters. Organized in collaboration with the National Gallery in London, this ambitious project brought together 65 paintings from various European and American museums that were commissioned by the Duke of Ferrara. IDEA collaborated with Blanca Sánchez Velasco, Gabriele Finaldi, and Miguel Falomir to adapt a portion of “Bellini’s Feast of the Gods” WebExhibit into a bilingual presentation (translated by Juan Silva) that included reconstructed views of earlier versions by Bellini and Dosso Dossi.


