Community Embraces New Word Game at Mid-Year Play Day This past Sunday, families at Takoma Park’s Seventh Annual Mid-Year Play Day had the opportunity to experience OtherWordly for the first time. Our educational language game drew curious children and parents to our table throughout the afternoon. Words in Space Several children gathered around our iPads […]
Read moreCategory: Interactive experiences
A new generation of small video cameras and consumer robotic helicopters make amazing video shots possible. Stick your phone on a drone for enchanting views of the natural world, architecture, museums, and more. Here’s a cool new video flying a drone around the NY public library:
 Images gain new meaning when given the context of location or change. Two sites, from NASA and HistoryPin do this to good effect — such as showing the the dramatic melting of the Muir glacier in Alaska, or how a city evolves.
Launched in autumn 2011 by a British nonprofit, HistoryPin pins historical items on a map. Their service demonstrates the potential for a global, crowdsourced database of historical media. (more…)
 The Grand Canyon is yet another place that Google brings to your digital screens, from their Street View family of content. Google has been collecting street-level views of our world at a vast scale possible only because of it’s deep pockets and technical expertise. (more…)
 In the era of tablets and smart phones, parents of small children may consider educational apps. Recently, the “Slashdot” online community discussed apps and kids. Nerdy parents chimed in with suggestions. This tech-savvy community is often reluctant to rely on apps, favoring “play time outside with soccer and baseballs, and inside with blocks, Hot Wheels, PlayDoh, etc.” But many parents found value in apps, at least occasionally.
Here’s a list of ten apps that computer nerds turn to when they want to engage their young kids in math and science… (more…)
 Most data is meaningless to most people — unless it is visualized. Stepping beyond familiar visualizations like bar charts and pie charts, there are many approaches to visualizing data, from mapping (e.g., color coding a map to show voting patterns) to visualizing networks (e.g., the links between people).
You are not limited to Microsoft Excel, or your own programming abilities. We’re now in an awesome generation for visualization, with dozens of freely available software libraries — which developers have spent months (or years!) building. Increasingly these use Javascript (so they work in all browsers and mobile devices). The folks at Datavisualization.ch highlight most of the best tools for making maps and charts, or processing data… (more…)
 Games and gaming principles have a useful role in exhibit design for both real world and virtual settings. “As educators, we’re always looking for ways to make museum content ‘stickier’ and more meaningful,” says Michelle Moon in a recent blog post, “All fun and games.” Moon designs and runs public programs for adults at the Peabody Essex Museum.
To get thinking about it, here are some simple game structures that work well for museum learning: (more…)
 What happens to a city when the people that lived there die off or are absorbed by others? War, disease and natural disaster can all wipe out anyone who might carry on the story and heart of a city. (more…)
 Over 30,000 objects are now available for anyone to savor and study online, for free, in impressive high resolution, in Google’s ‘Art Project.” This is 30x expansion from the thousand objects in the first version launched in February 2011. See our prior article, The virtual vs. the real: Giga-resolution in Google Art Project. The project now has 151 partners in 40 countries; in the U.S., the initial four museums has grown to 29 institutions, including the White House and some university art galleries.
See the site: Google Art Project (more…)
Online courses can be a great way to teach (and learn) new skills. They can be small and highly personal, or scale to thousands of students. As followup to my post about “What is an online course?”, let’s look behind the scenes at a few kinds of successful online classes, rich with video, feedback and large amounts of real-world work.
Structuring a course
![]() The Museum of Modern Art (MoMA) currently has six 8 or 10 week online courses. The cost is $200 for self-guided courses, or $350 for instructor-led. The latter enroll 30-45 students. MoMA offers both knowledge classes, e.g., “Modern and Contemporary Art: 1945–1989,” and knowledge/skill courses, e.g., “Materials and Techniques of Postwar Abstract Painting,” in which students do hands-on work at home.
The Museum of Modern Art (MoMA) currently has six 8 or 10 week online courses. The cost is $200 for self-guided courses, or $350 for instructor-led. The latter enroll 30-45 students. MoMA offers both knowledge classes, e.g., “Modern and Contemporary Art: 1945–1989,” and knowledge/skill courses, e.g., “Materials and Techniques of Postwar Abstract Painting,” in which students do hands-on work at home.
The instructor-led classes offer structure, socialization and personalization; whereas, the self-guided courses are about individual freedom, providing access to curated articles and video, with no live instructor facilitation nor social interaction with other students.
 The studio-art offerings have weekly assignments. For example, students paint canvases using the materials and techniques of iconic artists. They photograph their works in progress and finished, and upload them to discuss with other students and the instructor. Wendy Woon directs MoMA’s education department. She feels the 10-week timeframe has worked well for studio art, allowing enough time for a sense of trust and community to develop in the discussion forums so that students are willing to have “critical conversations” criticizing each other’s work.
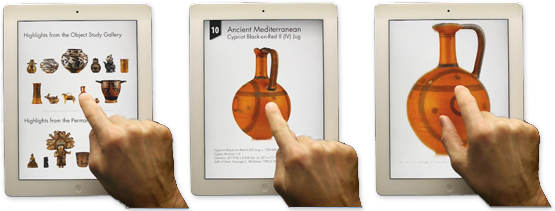
 A Hopi doll with painted headdress springs to life, spinning under my finger tips on a new iPad app from the University of Virginia Art Museum (UVaM).
The delightful app presents 19 different objects in 3D, to spin and zoom, providing an immediacy that rivals seeing an object in real life. In fact, it’s better in many ways than peering at an object through a protective case because the objects can be spun through a full 360°, view under bright lighting, at high resolution.
Personal exploration
The free app presents the mobile visitor with a grid of objects (below, left):


