Community Embraces New Word Game at Mid-Year Play Day This past Sunday, families at Takoma Park’s Seventh Annual Mid-Year Play Day had the opportunity to experience OtherWordly for the first time. Our educational language game drew curious children and parents to our table throughout the afternoon. Words in Space Several children gathered around our iPads […]
Read moreTag: HTML
 Most data is meaningless to most people — unless it is visualized. Stepping beyond familiar visualizations like bar charts and pie charts, there are many approaches to visualizing data, from mapping (e.g., color coding a map to show voting patterns) to visualizing networks (e.g., the links between people).
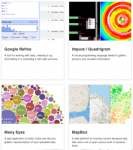
You are not limited to Microsoft Excel, or your own programming abilities. We’re now in an awesome generation for visualization, with dozens of freely available software libraries — which developers have spent months (or years!) building. Increasingly these use Javascript (so they work in all browsers and mobile devices). The folks at Datavisualization.ch highlight most of the best tools for making maps and charts, or processing data… (more…)

