Community Embraces New Word Game at Mid-Year Play Day This past Sunday, families at Takoma Park’s Seventh Annual Mid-Year Play Day had the opportunity to experience OtherWordly for the first time. Our educational language game drew curious children and parents to our table throughout the afternoon. Words in Space Several children gathered around our iPads […]
Read moreTag: interactivity
 Online courses with very large enrollments have rapidly matured in the last two years, led largely by experiments outside mainstream academia by Coursera, Udacity and edX. Ambitious educators, technologists, and funders have created courses on diverse topics, and over five million students worldwide have registered for classes. And 3% have completed the courses. What can we learn? (more…)
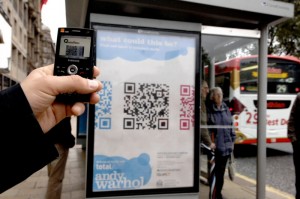
 QR codes are a way to send information to mobile devices (e.g., a smartphone) using its camera. You send a short blurb of text, or a web address (URL) by representing it as a code which people photograph from their phone.
The codes are easy to generate. Several web sites and software programs will make the codes for you.
 To read the codes, users need a QR reader app to take a snapshot of the code with their device’s camera. The app returns the decoded text or web URL.
In the photo at left, a pedestrian takes a photo of a QR code promoting an Andy Warhol show.
There are hundreds of barcode-reader apps (e.g., RedLaser and QuickMark for iOS and Android devices, and the Kaywa reader for dumber smartphones), and code-reading can be included in custom apps, e.g., a museum tour. (more…)
Viewing a sequence
June 2nd, 2006 by IDEA
Labeling sequences is paramount. The process of painting a canvas is personal and unique to each artist. Visitors step through the sequence which Philip Pearlstein used to paint a wedding portrait. (WebExhibits) View a the sequence of layers in an Incan mummy. (National Geographic) Problem You need to display a time-lapse sequence, or a
Incorporating intuitive graphs provides visitors with new insights. (more…)
Imparting greater understanding through object manipulation. (more…)
Views of data
June 1st, 2006 by IDEA
Reducing multidimensional data enables visitors to control what they see. (more…)
Displaying only selected data provides clarity and enhances discovery. Problem You need to display quantitative information about an image, such as calories of foods, carbon dioxide output per country, or the number of voters per state. Solution Display a fixed key alongside the image, and display or highlight relevant data as the visitor points at
Avoiding clutter while amplifying information. The pigment composition of a painting is revealed by examining microscopic views. The caption for each cross section is dynamically shown. (WebExhibits) Visitors explore the archaeological of the Theban Necropolis through a giant aerial photograph. Annotations appear on the photograph as the mouse is moved. (Theban Mapping Project) Users

